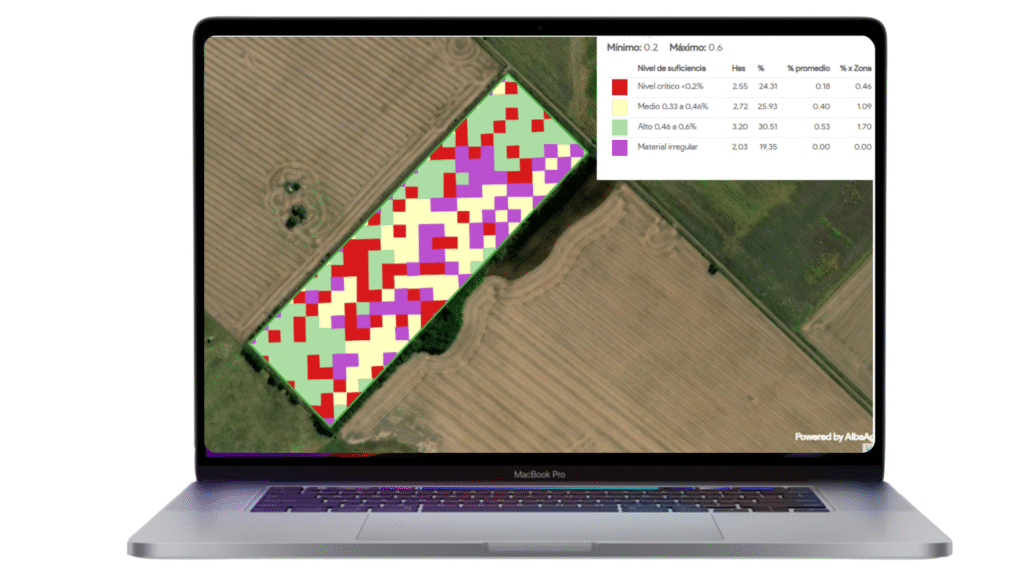
Sulfur (S) Nutrient Map - Sample
Interpretation
Sulfur (S) is a vital secondary macronutrient involved in protein synthesis, chlorophyll formation, and the activation of several key enzymes. It plays a particularly important role in leguminous crops and those with high protein content, like soybeans, canola, etc.
This map allows for a precise evaluation of sulfur distribution across your field, supporting smart decisions for fertilization and crop planning.
📊 Sulfur Levels & Interpretation
The numbers shown in this table may change depending on the type of crop analyzed and its consequently stage.
| Level | Range (% in dry matter) | Interpretation |
|---|---|---|
| Critical | < 0.1% | Severe deficiency. Affects amino acid production and chlorophyll development. Commonly results in pale leaves and stunted growth. |
| Low | 0.11 – 0.3% | Suboptimal for high-performance crops. May show mild chlorosis, especially in younger leaves. Requires supplemental sulfur for improved yields. |
| Medium | 0.31 – 0.45% | Adequate levels for most crop demands. Supports active protein synthesis and healthy growth. |
| High | 0.46 – 0.6% | Sufficient to high levels. Beneficial under intensive production systems. Monitor for balance with nitrogen to avoid excess. |
| Irregular Material | — | Crops in this area exhibit heterogeneous nutrient profiles and biomass, indicating great variability in field conditions. Further analysis is recommended to better understand these differences. |
| Over-sufficiency | > 0.6% | Sulfur levels above plant needs. Rarely toxic but may indicate over-fertilization or nutrient imbalance. Adjust inputs accordingly. |
💡 Tip: Sulfur mobility in soil is similar to nitrogen, meaning it can leach easily. This map helps prioritize timing and location of sulfur applications, especially in sandy or low-organic matter soils.

The map in the image shown above corresponds to the soybean crop in its reproductive stage.- Maps are available in 10 x 10 m and 3 x3 m pixel resolution.
 Table of contents including detailed parameters
 Time lapse graphics to evaluate trends and deviations.

