Manganese (Mn) Nutrient Map - Sample
Interpretation
Manganese (Mn) is a crucial micronutrient involved in photosynthesis, nitrogen metabolism, and the formation of essential enzymes in plants. It also supports disease resistance and contributes to the plant’s structural integrity.
This map helps visualize the spatial variability of Mn levels in crop tissue, enabling more accurate fertilization and management decisions based on real-time plant needs.
📊 Manganese Levels & Interpretation
The numbers shown in this table may change depending on the type of crop analyzed and its consequently stage.
| Level | Range (mg/kg in dry matter) | Interpretation |
|---|---|---|
| Critical | < 15 mg/kg | Severe deficiency. May lead to interveinal chlorosis and stunted growth, particularly in younger leaves. Immediate correction is essential. |
| Low | 16 – 77 mg/kg | Marginal levels. Crops may begin to show subtle signs of deficiency, especially in sandy or high-pH soils. |
| Medium | 78 – 139 mg/kg | Adequate for most crops. Supports healthy photosynthesis and enzyme activity. |
| High | 140 – 200 mg/kg | Ensures full metabolic function and resistance to oxidative stress. |
| Over-sufficiency | > 200 mg/kg | High levels may interfere with the functions of other micronutrients (e.g., Fe, Zn). Check for potential imbalance or toxicity symptoms. |
| Irregular Material | — | Crops in this area exhibit heterogeneous nutrient profiles and biomass, indicating great variability in field conditions. Further analysis is recommended to better understand these differences. |
💡 Tip: Manganese availability is strongly influenced by soil pH. and soil toxicity. It becomes less available in alkaline soils—a condition that should be managed to avoid hidden deficiencies
🌱 Why Use Manganese Crop Maps?
Identify early Mn deficiencies and apply targeted corrections
Prevent hidden hunger that affects yield without visible symptoms
Support enzyme systems critical for plant development
Correlate with soil pH and organic matter maps for better diagnosis
The map in the image shown above corresponds to the mandarins plantation in its post-harvest stage.- Maps are available in 10 x 10 m and 3 x3 m pixel resolution.
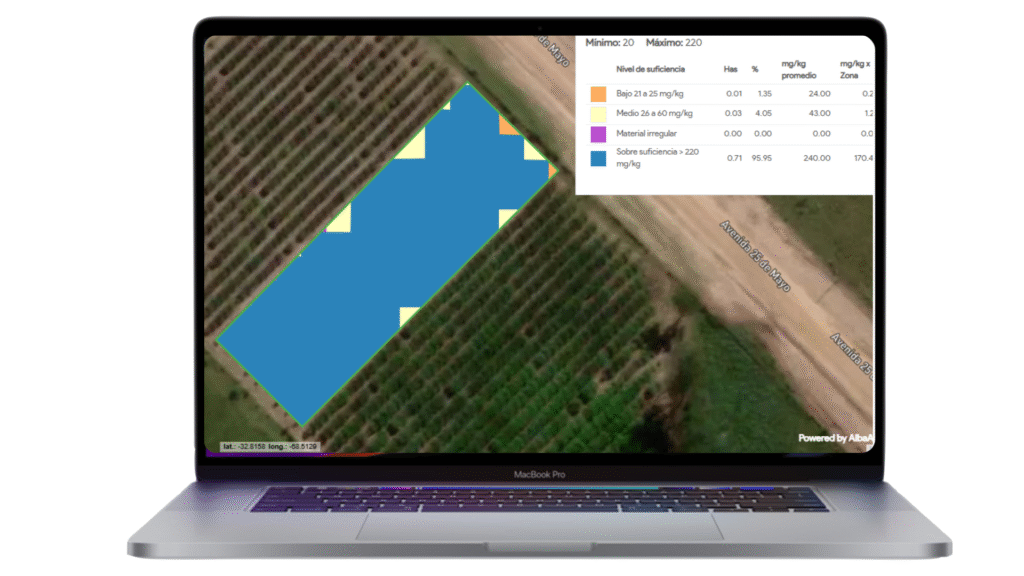
Table of contents including detailed parameters
Time lapse graphics to evaluate trends and deviations.

