Magnesium (Mg) Nutrient Map - Sample
Interpretation
Magnesium (Mg) is a vital secondary macronutrient for plant health. It is a central element in chlorophyll, essential for photosynthesis, and plays a key role in enzyme activation, energy metabolism, and the transport of carbohydrates.
This map represents the spatial distribution of magnesium content in crop tissue, helping identify areas of deficiency, balance, or excess to support precision agriculture strategies.
📊 Magnesium Levels & Interpretation
The numbers shown in this table may change depending on the type of crop analyzed and its consequently stage.
| Level | Range (% in dry matter) | Interpretation |
|---|---|---|
| Critical | < 0.15% | Severely deficient. May cause chlorosis in older leaves and significantly reduce photosynthetic efficiency and yield. Immediate correction is recommended. |
| Low | 0.16 – 0.44% | Magnesium levels may be insufficient to meet the plant’s demands, especially in soils with high potassium or calcium levels, which can interfere with Mg uptake. |
| Medium | 0.45 – 0.73% | Generally adequate for most crops. Maintains chlorophyll structure and supports enzyme functions. |
| High | 0.74 – 1.00% | No need for additional supplementation under normal conditions. |
| Over-sufficiency | > 1.00% | Excess Mg may interfere with calcium and potassium function. While not toxic, nutrient balance should be evaluated. |
| Irregular Material | — | Crops in this area exhibit heterogeneous nutrient profiles and biomass, indicating great variability in field conditions. Further analysis is recommended to better understand these differences. |
💡 Tip: Magnesium availability can be reduced in soils with high levels of K⁺ or Ca²⁺ due to ionic competition. Use Mg maps alongside potassium and calcium maps for complete nutrient analysis.
🌱 Why Use Magnesium Crop Maps?
Detect nutrient imbalances before visual symptoms appear
Optimize fertilization planning (e.g. use of dolomite or Mg foliar applications)
Maintain proper nutrient ratios (especially K:Mg and Ca:Mg)
Support crop health during every growth stage
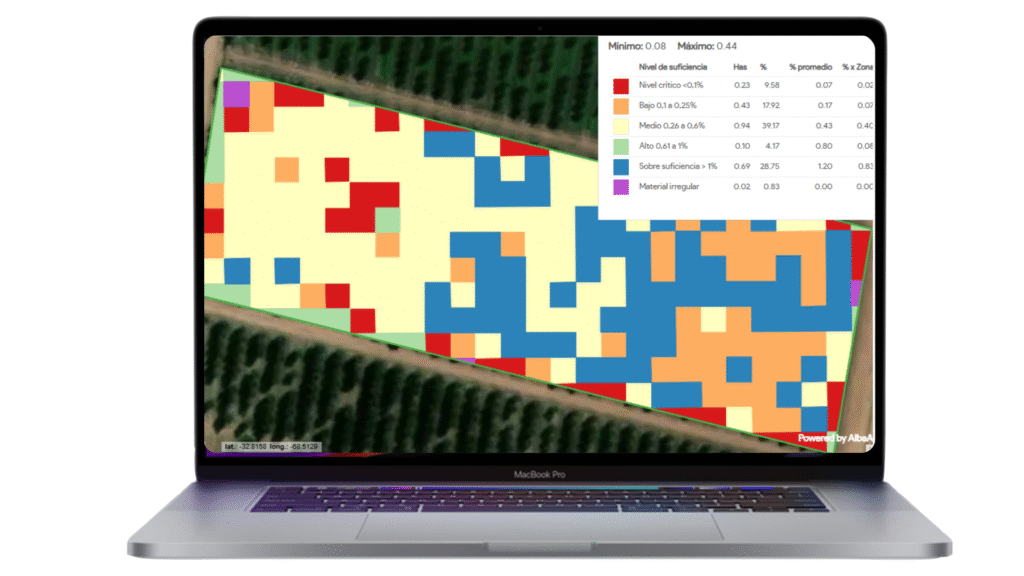
The map in the image shown above corresponds to the olive plantation in its veraison stage.
- Maps are available in 10 x 10 m and 3 x3 m pixel resolution.
Table of contents including detailed parameters.
Time lapse graphics to evaluate trends and deviations.

