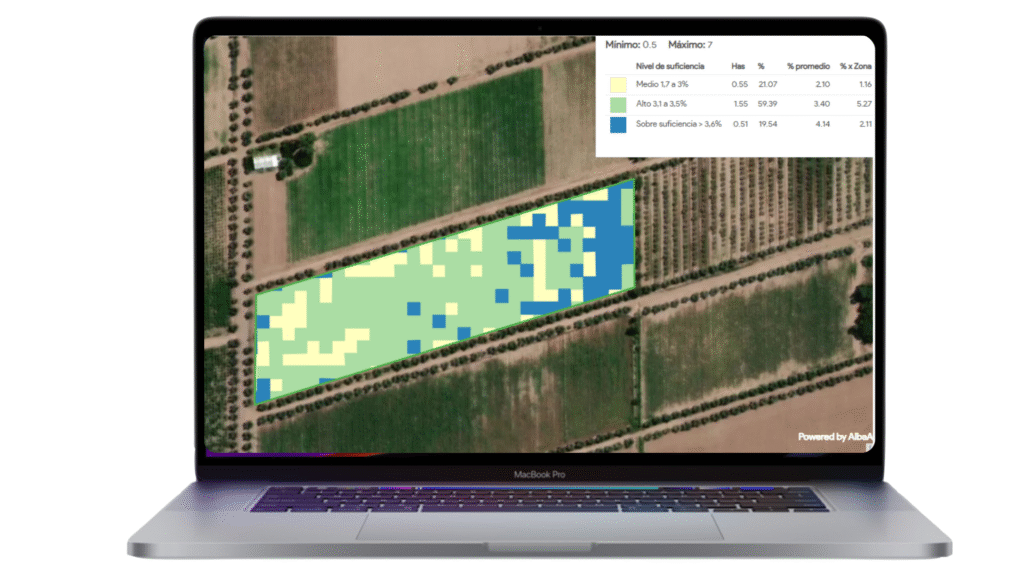
Potassium (K) Nutrient Map - Sample
Interpretation
Potassium is a key macronutrient that plays a critical role in water regulation, enzyme activation, sugar transport, and stress resistance in crops. Its availability is essential throughout the growing cycle, particularly during reproductive stages to support grain or fruit filling.
This map shows the distribution of potassium levels (%) in crop tissue, allowing for targeted interpretation and action.
📊 Potassium Levels & Interpretation
The numbers shown in this table may change depending on the type of crop analyzed and its consequently stage.
| Level | Range (%) | Interpretation |
|---|---|---|
| Critical | < 1.7% | Severe deficiency. May lead to poor water balance, weak stalks, marginal leaf burn, and reduced yield. Requires immediate correction. |
| Low | 1.7 – 2.1% | Suboptimal for high-demand stages. Crops may underperform under stress or during grain fill. Fertilization should be considered. |
| Medium | 2.11 – 2.4% | Balanced level for most crops. Supports normal growth and efficient nutrient/water use. |
| High | 2.41 – 2.655% | Well-nourished condition. No need for additional potassium at this stage. |
| Over-sufficiency | > 2.65% | Excess levels may lead to antagonism with magnesium (Mg) and calcium (Ca), potentially causing secondary deficiencies. Monitor balance. |
| Irregular Material | — | Crops in this area exhibit heterogeneous nutrient profiles and biomass, indicating great variability in field conditions. Further analysis is recommended to better understand these differences. |
🌾 Benefits of Potassium Mapping
Improves grain and fruit quality by ensuring proper filling stages
Supports stress tolerance (drought, cold, disease)
Enhances nutrient efficiency and plant metabolism
Prevents hidden deficiencies that don’t show visual symptoms
Optimizes fertilizer applications based on spatial variability

The map in the image shown above corresponds to a garlic crop.- Maps are available in 10 x 10 m and 3 x3 m pixel resolution.
 Table of contents including detailed parameters
 Time lapse graphics to evaluate trends and deviations.

