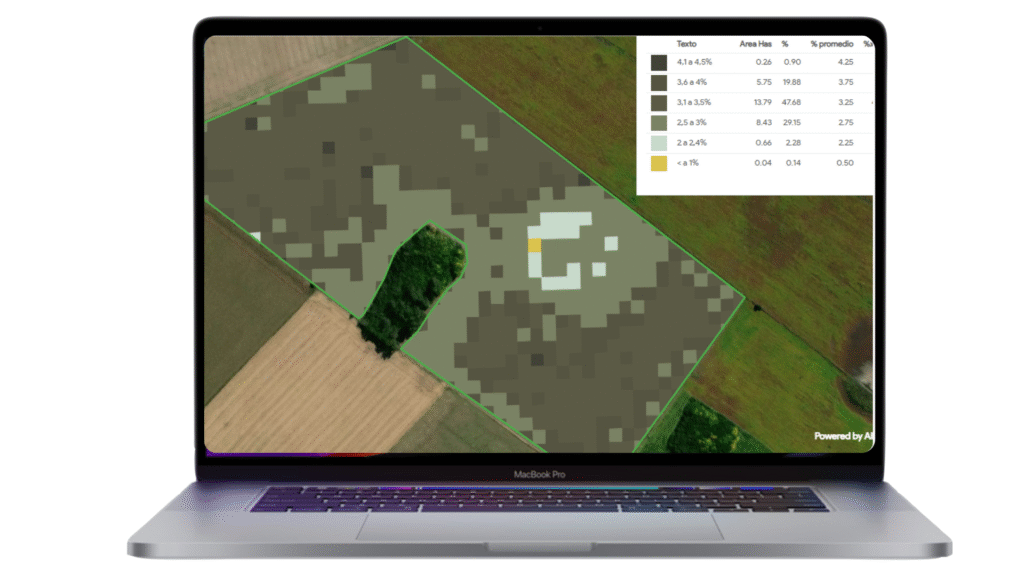
🌾 Soil Organic Matter (MO) Map
Interpretation Guide
This map displays the levels of organic matter (MO) in soils with green cover, measured to a depth of 20 cm.
🧪 What is Soil Organic Matter?
Soil Organic Matter is a key agronomic indicator that helps assess:
The capacity of soil to retain useful water, and
The availability of nutrient reserves (both medium- and long-term) essential for plant development.
- Improved soil structure and enhanced biological activity.
📊 Classification Table of MO Levels
| Code | MO (%) Range | Interpretation |
|---|---|---|
| 1 | 4.6% – 5.0% | Excellent organic matter content – highly favorable for crop growth and soil structure. |
| 2 | 4.1% – 4.5% | Very good – maintains soil fertility and water retention. |
| 3 | 3.6% – 4.0% | Good – supports productive agriculture with moderate reserves. |
| 4 | 3.1% – 3.5% | Acceptable – reasonable balance of nutrients and structure. |
| 5 | 2.5% – 3.0% | Moderate – lower capacity for water and nutrient retention. May require management. |
| 6 | 2.0% – 2.4% | Low – soil fertility may be limited, organic amendments recommended. |
| 7 | 1.5% – 1.9% | Very low – likely constraints on plant development. Improve with cover crops or compost. |
| 8 | 1.0% – 1.4% | Poor – minimal organic matter, urgent need for soil restoration. |
| 9 | < 1.0% | Critical – severe limitations for agriculture without remediation. |
✅ Use This Map To:
Identify areas that require organic matter improvement.
Plan targeted fertilization and water management.
Monitor the impact of conservation practices over time.
- Prevent a potential lack of macronutrient in the leaves.

- Maps are available in 10 x 10 m resolution.
 Table of contents including detailed parameters.
 Time lapse graphics to evaluate trends and deviations.

