
Sulfur (S) is an essential macronutrient required for the synthesis of amino acids (methionine and cysteine), proteins, and enzymes that influence plant growth, chlorophyll formation, and nitrogen optimization.
In agricultural systems, maintaining optimal levels of available sulfur in the top 20 cm of soil ensures balanced crop nutrition, improved grain and forage quality, and efficient fertilizer use.
 What Does This Map Show?
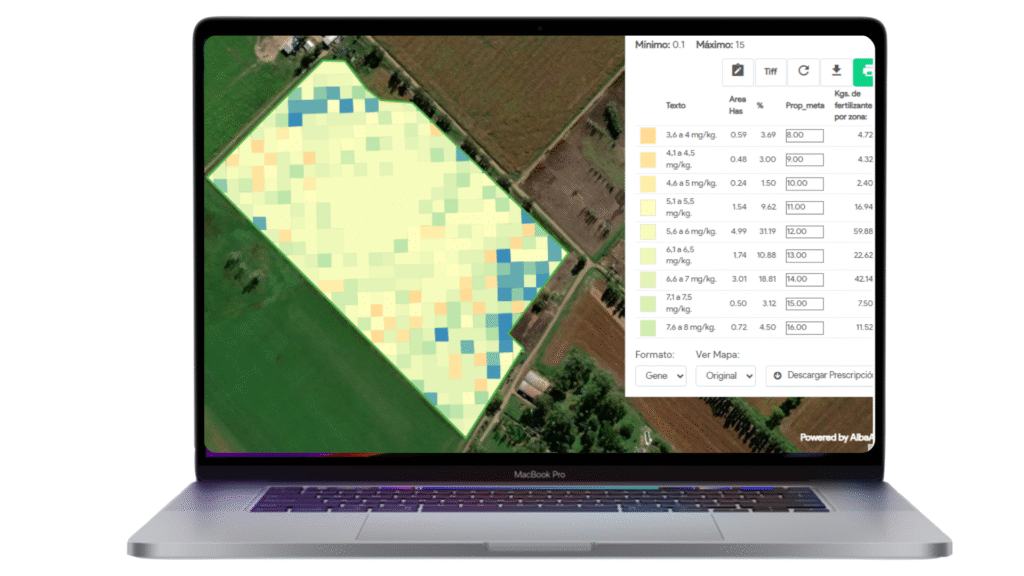
The Sulfur (S) Map (0–20 cm) displays the available sulfur content in milligrams per kilogram (mg/kg) across different field zones.
Each zone represents a range of sulfur concentration determined by satellite-assisted soil diagnostics or laboratory calibration points.
| DN Code | Sulfur Concentration (mg/kg) | Interpretation |
|---|---|---|
| 1 | 0 – 0.5 mg/kg | Extremely Low – Supplementation required |
| 2 | 0.6 – 1.0 mg/kg | Very Low – Supplementation required |
| 3 | 1.1 – 1.5 mg/kg | Low – Deficiency symptoms may appear – Supplementation required |
| 4 | 1.6 – 2.0 mg/kg | Moderate-Low – Deficiency likely |
| 5 | 2.1 – 2.5 mg/kg | Moderate – Deficiency likely |
| 6 | 2.6 – 3.0 mg/kg | Moderate to Sufficient |
| 7 | 3.1 – 3.5 mg/kg | Sufficient |
| 8 | 3.6 – 4.0 mg/kg | Sufficient – Optimal for most crops |
| 9 | 4.1 – 4.5 mg/kg | Good |
| 10 | 4.6 – 5.0 mg/kg | Good to High |
| 11 | 5.1 – 5.5 mg/kg | High |
| 12 | 5.6 – 6.0 mg/kg | High |
| 13 | 6.1 – 6.5 mg/kg | Very High |
| 14 | 6.6 – 7.0 mg/kg | Very High |
| 15 | 7.1 – 7.5 mg/kg | Excessive |
| 16 | 7.6 – 8.0 mg/kg | Excessive |
| 17 | 8.1 – 8.5 mg/kg | Very Excessive |
| 18 | 8.6 – 9.0 mg/kg | Very Excessive |
| 19 | 9.1 – 9.5 mg/kg | Extremely High |
| 20 | 9.6 – 10.0 mg/kg | Extremely High |
| 21 | 10.1 – 10.5 mg/kg | Oversupply |
| 22 | 10.6 – 11.0 mg/kg | Oversupply |
| 23 | 11.1 – 11.5 mg/kg | Oversupply |
| 24 | 11.6 – 12.0 mg/kg | Oversupply |
| 25 | 12.1 – 12.5 mg/kg | Excessive Accumulation |
| 26 | 12.6 – 13.0 mg/kg | Excessive Accumulation |
| 27 | > 13.0 mg/kg | Very High / Potential Toxicity |
 Interpretation & Agronomic Recommendations
< 2 mg/kg (DN 1–4) → Deficient zone.
Crops may exhibit pale leaves and reduced growth. Apply sulfur-containing fertilizers (e.g., gypsum, ammonium sulfate).2–4 mg/kg (DN 5–8) → Adequate range.
Typical optimal levels for most cereals and legumes; maintain through balanced fertilization.4–7 mg/kg (DN 9–14) → High range.
Generally safe and productive, but monitor if combined with saline or sodic soils.> 7 mg/kg (DN 15–27) → Excessive sulfur content.
Could result from waterlogging, sulfate-rich irrigation, or industrial contamination.
Consider improving drainage and verifying pH balance.
 Applications of the Sulfur Map
 Identify nutrient-deficient zones for variable-rate fertilization Optimize nitrogen use efficiency (since S supports N assimilation) Integrate with organic matter and moisture maps for complete fertility diagnostics Monitor environmental sulfur accumulation from fertilizers or irrigation
 Integration with Other Maps
Combine the Sulfur Map with:
Nitrogen (N) Maps – for balanced N:S ratios
Calcium (Ca) and pH Maps – to assess cation–anion interactions
Soil Water Maps – to study sulfate mobility and leaching risks
 Available Formats
Available in PDF, PNG, and GIS-compatible formats (GeoTIFF, SHP, KMZ)
Fully compatible with precision agriculture systems for variable-rate applications
 Get in Touch
Would you like to identify sulfur-deficient areas or balance nutrient interactions in your soil?
Contact our technical team to request your Sulfur (S) Map (0–20 cm) and improve your soil fertility management strategy.
- Maps are available in 10 x 10 m resolution.
 Table of contents including detailed parameters
 Time lapse graphics to evaluate trends and deviations.
- Prescriptions for fertilizer application available.