🧪 Nitrate (NO₃⁻) Map – Nitrogen Availability in Soil
Interpretation Guide
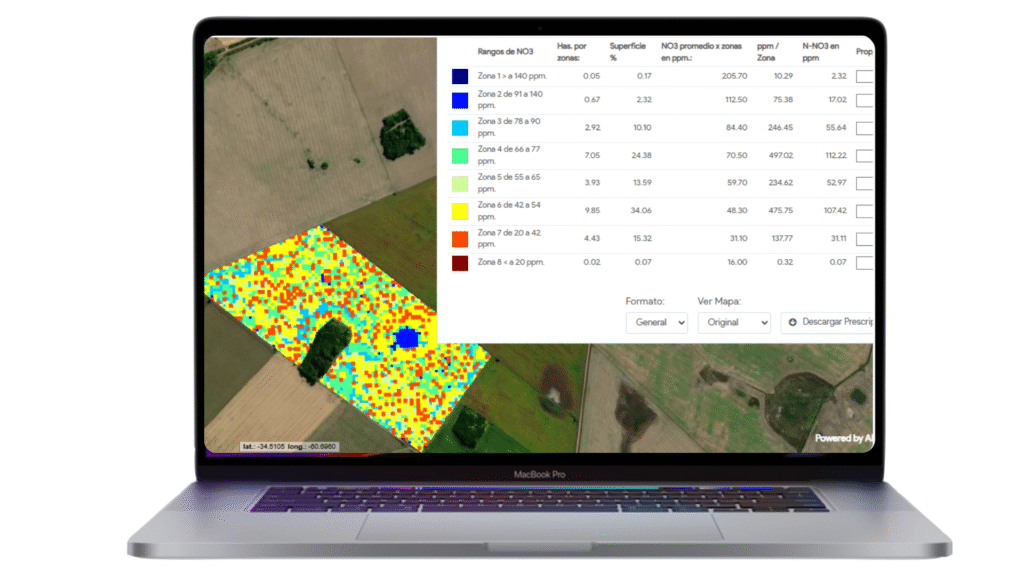
This map illustrates the concentration of nitrate (NO₃⁻) in the soil, measured in parts per million (ppm), across your field up to 20 cm of depth. Nitrate is the most readily available form of nitrogen, vital for plant growth and productivity.
📈 Interpretation of NO₃⁻ Levels (0–140 ppm)
Range (ppm)
Meaning
0–20 ppm
Very low – Risk of nitrogen deficiency; may result in stunted growth and pale leaves.
20–50 ppm
Moderate – May be sufficient in early stages or for low-demand crops. Monitor during high rainfall.
50–90 ppm
Optimal – Supports strong vegetative growth and biomass accumulation. Ideal for most crops.
90–120 ppm
High – Indicates surplus nitrogen; potential leaching risk if not managed.
120–140+ ppm
Very high – May lead to nutrient imbalance, excessive vegetative growth, or environmental runoff.
🌱 Why This Map Matters
Identify zones needing fertilizer adjustment
Optimize crop performance and reduce input costs
Prevent nitrogen leaching and environmental impact
Combine with other maps (e.g., phosphorus, calcium among others) for precision agriculture
Maps are available in 10 x 10 m resolution.
Available images every 5 days.
Table of contents including detailed parameters
Time lapse graphics to evaluate trends and deviations.
Prescriptions for fertilizer application available.

 Available images every 5 days.
 Table of contents including detailed parameters
 Time lapse graphics to evaluate trends and deviations.