| Critical | < 15 mg/kg | Severe deficiency. Likely to cause stunted growth, leaf discoloration (especially interveinal chlorosis), and poor flowering or fruit set. Immediate correction needed. |
| Low | 15 – 43 mg/kg | Suboptimal. Early signs of deficiency may occur under high demand or stress. Supplemental Zn may be beneficial, particularly in corn, wheat, and legumes. |
| Medium | 44 – 72 mg/kg | Adequate levels. Supports healthy plant development and yield. Regular monitoring advised under intensive cropping systems. |
| High | 73 – 100 mg/kg | Optimal to high. Generally beneficial, though unnecessary supplementation should be avoided. |
| Toxic | > 100 mg/kg | Risk of toxicity. May interfere with phosphorus uptake and root function. Evaluate soil balance and application rates. |
| Irregular or Minimal Surface Material | — | Crops in this area exhibit heterogeneous nutrient profiles and biomass, indicating great variability in field conditions. Further analysis is recommended to better understand these differences. |

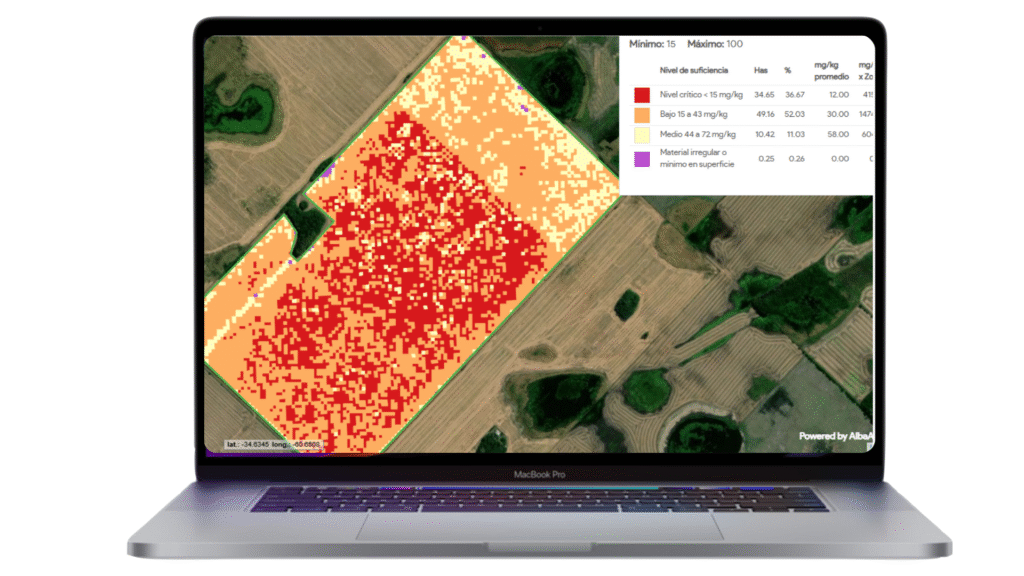
 Table of contents including detailed parameters
 Time lapse graphics to evaluate trends and deviations.