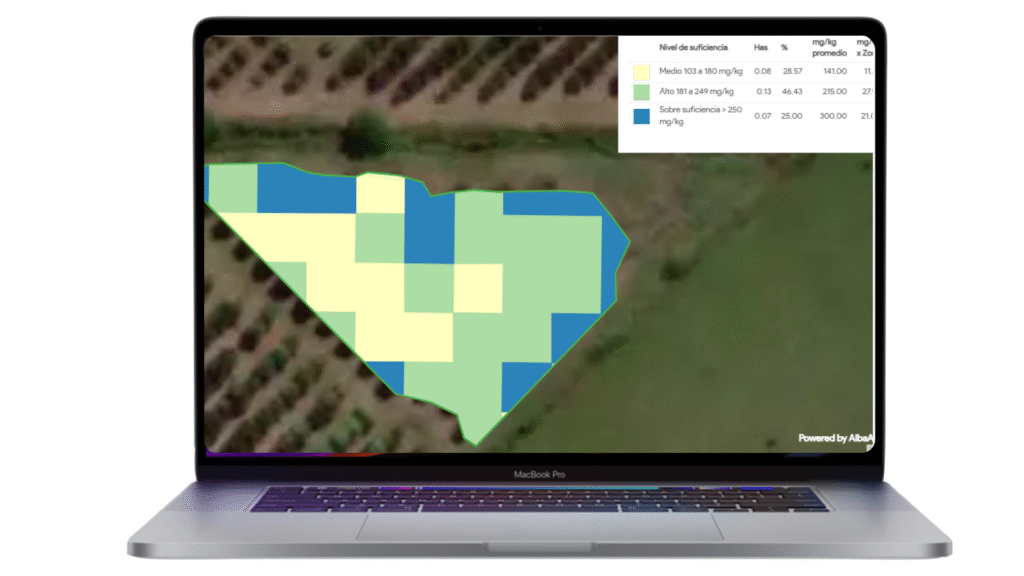
Iron (Fe) Nutrient Map - Sample
Interpretation
Iron is a vital micronutrient required for chlorophyll synthesis, energy transfer, and enzyme function in plants. Despite being abundant in most soils, iron deficiency frequently occurs due to poor availability, especially in high pH (alkaline), hypoxia, top soil compaction or calcareous soils.
This map shows the distribution of iron concentrations in plant tissue (mg/kg), providing critical insight into crop nutritional balance and hidden deficiencies.
📊 Iron Levels & Interpretation
The numbers shown in this table may change depending on the type of crop analyzed and its consequently stage.
| Level | Range (mg/kg) | Interpretation |
|---|---|---|
| Critical | < 11 mg/kg | Severe deficiency. Likely to result in chlorosis (yellowing between leaf veins), reduced photosynthesis, and stunted growth. Urgent corrective measures are needed. |
| Low | 12 – 100 mg/kg | Suboptimal levels. May not show visible symptoms, but can limit productivity in sensitive crops under stress. Monitor and adjust nutrient program if needed. |
| Medium | 101 – 200 mg/kg | Adequate concentration for most crops. Supports healthy vegetative growth and chlorophyll function. |
| High | 201 – 300 mg/kg | More than sufficient. No additional iron application required unless imbalances with other nutrients exist. |
| Over-sufficiency | > 300 mg/kg | Potential for nutrient antagonism or toxicity. May interfere with uptake of phosphorus, manganese, or zinc. Soil testing and further investigation recommended. |
| Irregular Material | — | Unreliable data from this area due to variability in sampling or environmental anomalies. Further sampling recommended. |
** If either of these scenarios happens, we recommend doing a parallel diagnosis using maps such as compaction or calcium in soil.
🌱 Why Iron Mapping Matters
Detects early-stage chlorosis and photosynthetic limitations
Helps guide fertilizer decisions in calcareous or alkaline soils
Ensures iron levels are balanced with other micronutrients like Mn, Zn, and Cu
Enables site-specific treatments to improve crop vigor

The map in the image shown above corresponds to the orange plantation in its DDF stage between 80 and 120.
- Maps are available in 10 x 10 m and 3 x3 m pixel resolution.
 Table of contents including detailed parameters
 Time lapse graphics to evaluate trends and deviations.

