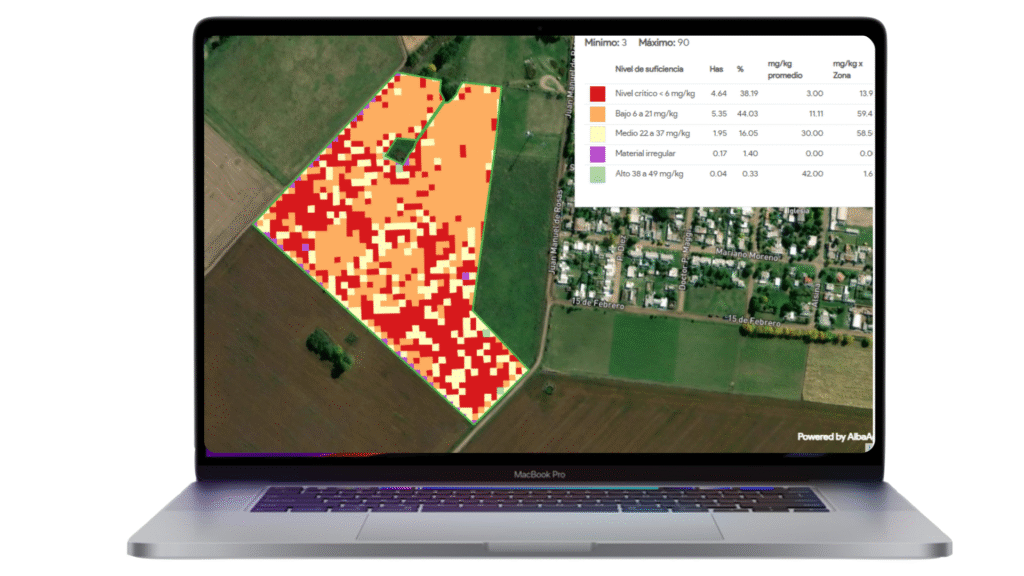
Copper (Cu) Nutrient Map - Sample
Interpretation
Visualize the spatial variability of copper in your crops with this high-resolution nutrient map. Copper is a micronutrient essential for enzyme activation, photosynthesis, and reproductive development in many crops. Even though required in small amounts, its deficiency or excess can have significant effects on yield and crop quality.
This map reflects copper concentration in plant tissue (mg/kg), helping you make informed agronomic decisions.
📊 Copper Levels & Interpretation
The numbers shown in this table may change depending on the type of crop analyzed and its consequently stage.
| Level | Range (mg/kg) | Interpretation |
|---|---|---|
| Critical | < 6 mg/kg | Severe copper deficiency. Can lead to stunted growth, reduced flowering, and poor grain or fruit set. Immediate correction is advised. |
| Low | 7 – 11 mg/kg | Below optimal. May cause hidden hunger symptoms especially under high organic matter or alkaline conditions. Monitor and consider foliar application. |
| Medium | 12 – 17 mg/kg | Adequate for most crop requirements. Supports healthy development and reproductive success. |
| High | 18 – 22 mg/kg | Sufficient to abundant levels. No intervention needed unless other micronutrients show imbalance. |
| Over-sufficiency | > 22 mg/kg | Excess copper may become toxic, especially for sensitive crops. May inhibit uptake of iron (Fe) and zinc (Zn). Monitor closely. |
| Irregular Material | — | Crops in this area exhibit heterogeneous nutrient profiles and biomass, indicating great variability in field conditions. Further analysis is recommended to better understand these differences. |
🌱 Why Copper Mapping Matters
Detects micronutrient deficiencies that often go unnoticed until yield loss occurs
Ensures reproductive development and grain quality
Supports balanced nutrition in conjunction with Zn, Fe, and Mn
Enables targeted foliar or soil copper application
- Prevents fungi from affecting the health of the crops.

The map in the image shown above corresponds to the wheat crop in its pre-flowering stage.- Maps are available in 10 x 10 m and 3 x3 m pixel resolution.
 Table of contents including detailed parameters
 Time lapse graphics to evaluate trends and deviations.

