
Calcium (Ca) Nutrient Map - Sample
Interpretation
Understand the distribution of calcium in your crop fields with this high-resolution nutrient map. Calcium plays a crucial role in cell wall development, root system strength, and nutrient transport, making it vital for crop health and productivity.
This map shows calcium levels in plant tissue (dry matter %) during the crop’s growth cycle, allowing you to identify areas with potential nutrient limitations or excesses.
📊 Calcium Levels & Interpretation
The numbers shown in this table may change depending on the type of crop analyzed and its consequently stage.Level Range (% in Dry Matter) Interpretation Critical < 0.2% Calcium deficiency. Severely limits root development and structural integrity. Immediate intervention is required, mostly in flowering stage. Low 0.2 – 0.5% Crop development may be compromised, particularly in acidic soils. Supplement recommended. Medium 0.51 – 0.75% Adequate for moderate growth. Monitor moisture and competing nutrients (Mg and K). High 0.76 – 1.0% Healthy calcium availability. Supports good development and cell function. Over-sufficiency > 1.0% Excessive calcium. May antagonize uptake of other nutrients like Magnesium (Mg), Potassium (K), and Sulfur (S). Monitor balance. Irregular Material — Crops in this area exhibit heterogeneous nutrient profiles and biomass, indicating great variability in field conditions. Further analysis is recommended to better understand these differences. Low Coverage — Limited vegetation coverage affects reading accuracy. Interpret with caution. Very Low Coverage — Minimal plant tissue detected. Not suitable for diagnosis. Reproductive Stage Interpretation
- Understand the distribution of calcium in your crop fields with this high-resolution nutrient map. Calcium plays a crucial role in cell wall development, root system strength, and nutrient transport, making it vital for crop health and productivity.
This map shows calcium levels in plant tissue (dry matter %) during the crop’s growth cycle, allowing you to identify areas with potential nutrient limitations or excesses.
🌱 Why Calcium Mapping Matters
Early detection of nutrient imbalances
Helps prevent hidden hunger that doesn’t show symptoms until it reduces yield
Allows precision application of amendments (lime, gypsum)
Supports balanced nutrition plans and pH management
risk.
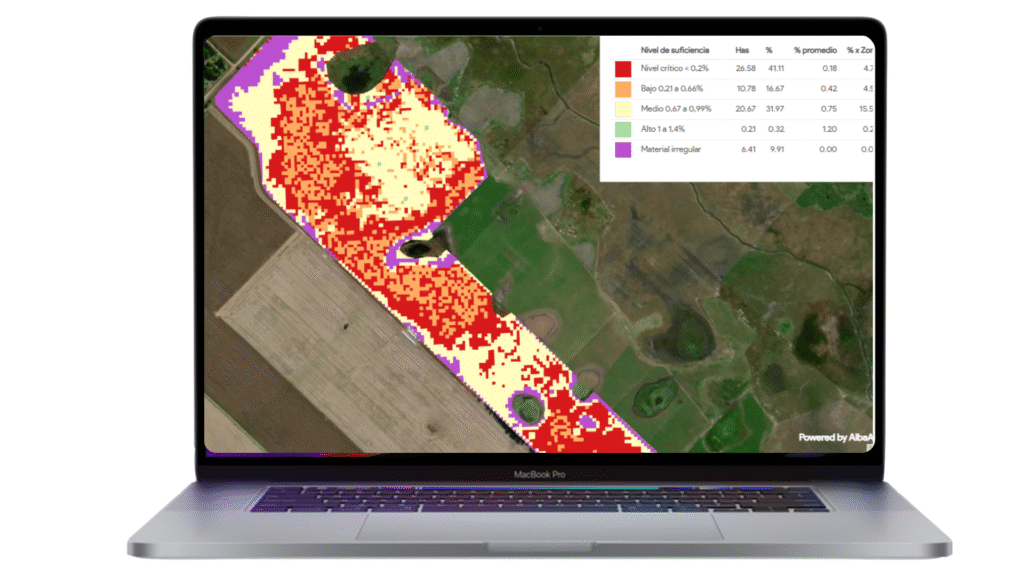
The map in the image shown above corresponds to the wheat crop in its pre-flowering stage.- Maps are available in 10 x 10 m and 3 x3 m pixel resolution.
 Table of contents including detailed parameters
 Time lapse graphics to evaluate trends and deviations.