| Critical | < 4 mg/kg | Severe deficiency. Can lead to poor flowering, sterility, and malformed tissues. Immediate correction is crucial during early reproductive phases. |
| Low | 4 – 12 mg/kg | Suboptimal levels. May not show symptoms immediately but can reduce yield potential, especially in boron-sensitive crops. |
| Medium | 13 – 19 mg/kg | Adequate for most crops. Supports strong structural development and optimal reproductive growth. |
| High | 20 – 25 mg/kg | Sufficient and balanced. Ensures robust plant structure and efficient sugar transport. |
| Over-sufficiency | > 25 mg/kg | Excess levels. Risk of toxicity, especially in sandy or low-organic-matter soils. Monitor closely. |
| Irregular Material | – | Crops in this area exhibit heterogeneous nutrient profiles and biomass, indicating great variability in field conditions. Further analysis is recommended to better understand these differences. |

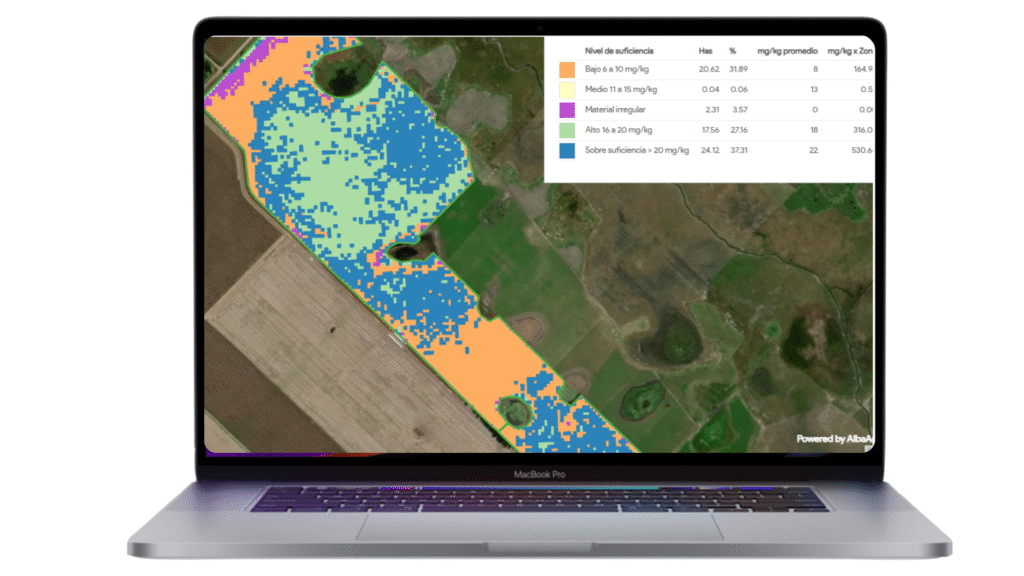
 Table of contents including detailed parameters.
 Time lapse graphics to evaluate trends and deviations.